If you experience crashes of Visual Studio, typically when working with a very large solution, your IDE might be out of virtual memory. Typical indicators of the problem include a "one or more errors occurred" message, "the process appears to be deadlocked" message, and OutOfMemory exception in a crash dump.
The following actions will reduce the virtual memory footprint of Visual Studio and may prevent the crashes:
1) Disable or pause default C/C++ Intellisense. If you prefer not to disable it, then try reducing Max Cached Translation Units:
Tools | Options | Text Editor | C/C++ | Advanced | Max Cached Translation Units
2) If you are using Visual Studio 2010 or newer, restrict the loading of debug symbols to those from specified DLLs and EXE. Enable the following in the debug options of the IDE:
Debug | Options | Symbols | Only specified modules
Subsequently, load symbols from specific modules via Right+Click in the Modules or Call Stack toolwindows. Learn more at:
https://msdn.microsoft.com/en-us/library/4c8f14c9.aspx
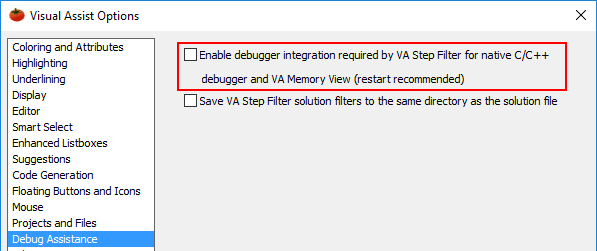
3) Disable integration between Visual Assist and the native debugger. Disable the integration in the options dialog of Visual Assist and then restart your IDE.

4) Reduce Visual Assist Parse Concurrency to a single thread.
5) Disable Code Inspection (on the Code Inspection page of the Visual Assist Options dialog).
6) Disable full solution analysis in Visual Studio:
Tools | Options | Text Editor | C# | Advanced | Editor Help | Enable full solution analysis
Visual Studio 2017
See the Visual Studio Team Blog for additional suggestions that reduce virtual memory in Visual Studio 2017.