Code Inspection analyzes C/C++ for specific code quality issues as you edit. The feature, based on LLVM/Clang, warns you of issues in your code and if possible, suggests and applies quick fixes.
Access
Enable Code Inspection in the options dialog for Visual Assist.

Individual code issues are listed in a tool window and highlighted in the text editor. The first few characters of an issue are underlined.

Access in the Text Editor
When enabled, code issues are highlighted in the text editor.
The first few characters of most code issues are underlined in solid or dotted fashion. To understand an issue, hover over the underlined characters.

If an issue is dimmed or underlined solid, a quick fix is available.
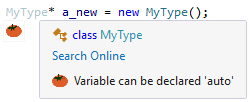
If an issue is underlined dotted, a fix is not available.

Access to a quick fix is available via mouse or keyboard.

If the option to display tomato buttons is enabled in the options dialog for Visual Assist, quick fixes are available by mouse.
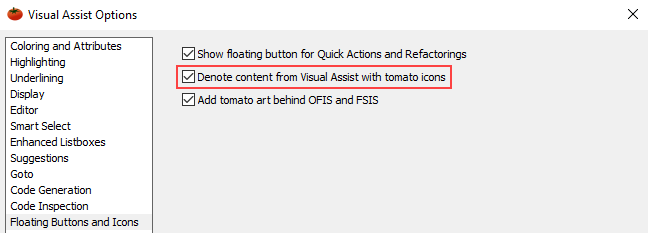
Hover over an issue and click the tomato button to access the fix.
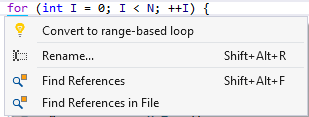
Whether or not tomato buttons or highlighting via underlines is enabled, fixes are always available in the Quick Action and Refactoring menu (Shift+Alt+Q), invoked when the caret is on the first characters of an issue.
Accept a fix to apply it.

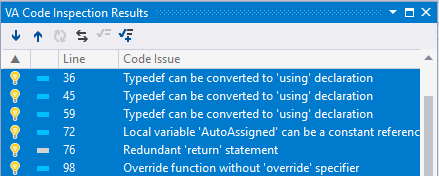
Open the VA Code Inspection Results to see all code issues for the current file, whether or not their underlining is enabled.

By default, issues are sorted by line number.
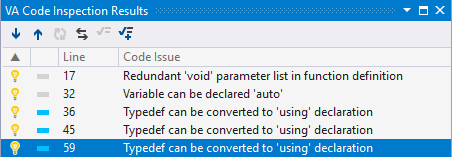
Double-Click an issue in the tool window to bring it into view in the text editor.

Fixes in the tool window are available via its context menu.

Fixes can be applied to single or multiple selections.
Grouping in the Tool Window
Use the context menu in the tool window to group issues by code inspection or level.
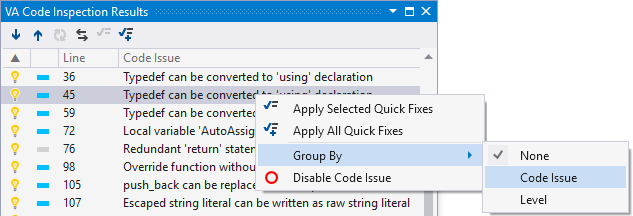
When grouped, apply fixes to all issues for a group by opening the context menu on the group row.

When grouped, sort order applies to issues within each group. Change sort by clicking a column header.
Tracking
Enabled tracking in the tool window to have its contents scroll as you move within the text editor.

When tracking is enabled, the selection in the tool window changes when the caret in the editor lands on a code issue, whether or not issues are underlined.
Ticks in the scroll bar of the text editor identify locations and levels of code issues. Hover over a tick for details.

Ticks that represent multiple issues contain details for all of them, omitting duplicates.

Select a tick to bring it into view.

Ticks can appear whether or not underlining is enabled.
Enabling/Disabling of Individual Inspections
Individual code inspections can be enabled/disabled in the options dialog for Visual Assist.

Individual inspections can also be disabled in the tool window. Disabling is available whether or not code issues are grouped. Enabling of inspections from the tool window is not available.
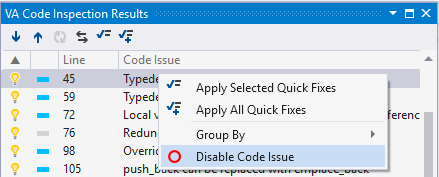
Individual inspections cannot be enabled/disabled from the text editor.
When disabled, code issues for the affected inspection do not appear in the text editor or tool window. If you want to see code issues in the tool window but not in the text editor, disable only their underlining and appearance in the scroll bar; enable the individual inspections.

Individual code inspections are automatically inactive when the toolset for the current project does not support their respective quick fixes, e.g. declaration of a variable using 'auto', which was introduced in C++11.
Disabling Code Inspections for Specific Code Sections
To avoid disabling global code inspections that could affect all files and folders in your code, directives in source comments prevent issues from being flagged in particular instances. Code Inspections can be selectively disabled in sections of your code using directives in comments.
- This comment disable Code Inspections results from the entire file, it can go on any line in the file:

- Skip Code Inspection results of the current line:

- Disable Code Inspection results of 10 lines, starting with current line and going down:

- Disable Code Inspection results of 10 lines, starting with current line and going up:

- Remove Code Inspection results before the line where the comment is included:

- Remove Code Inspection results after the line where the comment is included:

All vaCI:skip directives may optionally specify a list of inspections (listed by checker names that are matched by substring) that the directive should apply to (otherwise, the directive applies to all inspections). The following example will suppress modernize-make-unique and modernize-make-shared issues on the next 10 lines:

Visual Assist also helps in the process of transitioning from ReSharper, the code inspection functions recognizes the clang-tidy skip directives. The following is an example of how they should be stated:

Code Inspection honors clang-tidy NOLINT and NOLINTNEXTLINE comments.
Adjusting Individual Inspections
Several code inspections allow adjusting of their respective quick fixes. Access adjustments via the gear icons to the right of the inspections.

Levels
Code inspection levels represent roughly severity, with level one being critical and five a notice. Re-assign levels in the options dialog for Visual Assist.

Levels vary in the user interface only by color although level five issues are dimmed, not underlined, in the text editor. Level affects no other functionality.
Level Colors
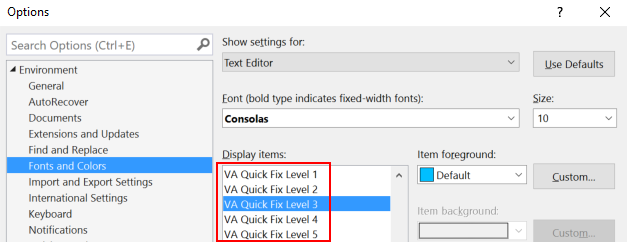
Change colors associated with levels one-five in the options dialog of Visual Studio. Color for levels one-four is effective in the tool window and text editor. Color for level five is effective in the tool window and only the scrollbar margin of the text editor. (Level five issues are dimmed in the text editor, not underlined.)
Clang Check Name
The Clang check name is an identifier that helps you find your code issue description through the code inspection. For more information, see List of Code Inspections.

Undo
Quick fixes can be undone only in the text editor, even if fixes are applied from the tool window. For fixes applied to a group, one undo reverts all of the fixes.
Parsing
By default, the LLVM/Clang parser underlying Code Inspection becomes active only when there is a pause in editing. The Code Inspection parser is independent of the built-in and Visual Assist parsers that provide IntelliSense and other coding assistance. But unlike parsing for IntelliSense, Code Inspection requires parsing of only the active file.
Disable automatic re-parsing if it interferes with the responsiveness of Visual Studio or consumes battery power. Disable automatic re-parsing also if you view code issues only in the tool window, i.e. you have disabled their underlining and ticks in the scroll bar.

Manually parse for code issues in the tool window. The button to parse is enabled only when automatic re-parsing is disabled.

Additional Options
Additional options are available at the bottom of the options dialog for Visual Assist to help you filter advanced information.

Helps you perform a specific code inspection. Type a string and find its description or underlying Clang check name.
Displays all supported adjustments available for each code issue listed in the tool window.
Hides all supported adjustments available for each code issue listed in the tool window.
-
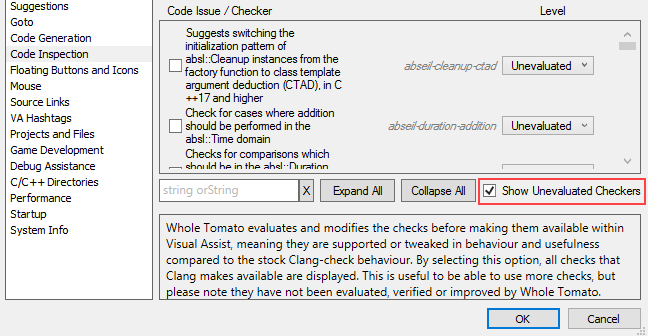
Show Unevaluated Checkers
Enable it to see all possible unevaluated clang checkers.
Compiler Errors
If the LLVM/Clang parser underlying Code Inspection detects a compiler error with the active document, inspection within the document ceases at the location of the error. Code Inspection beyond the error resumes after the error is resolved.
Registry Settings
Visual Studio 2008 and older
Code Inspection is not available.